As of November 2026: 4,380 metrics · 13 sectors · 364,000 current values and 9.5 million historical ones · sources from 108 websites · 3,669 metrics with year-by-year history, back to 1900 · 51 industrial system guides
China Industry Visualizer compares China with other countries across output, capacity, trade, infrastructure, and industrial knowledge. Every metric cites a source and carries a confidence level and an evidence tier. Nearly nine in ten are rated high or medium-high confidence.
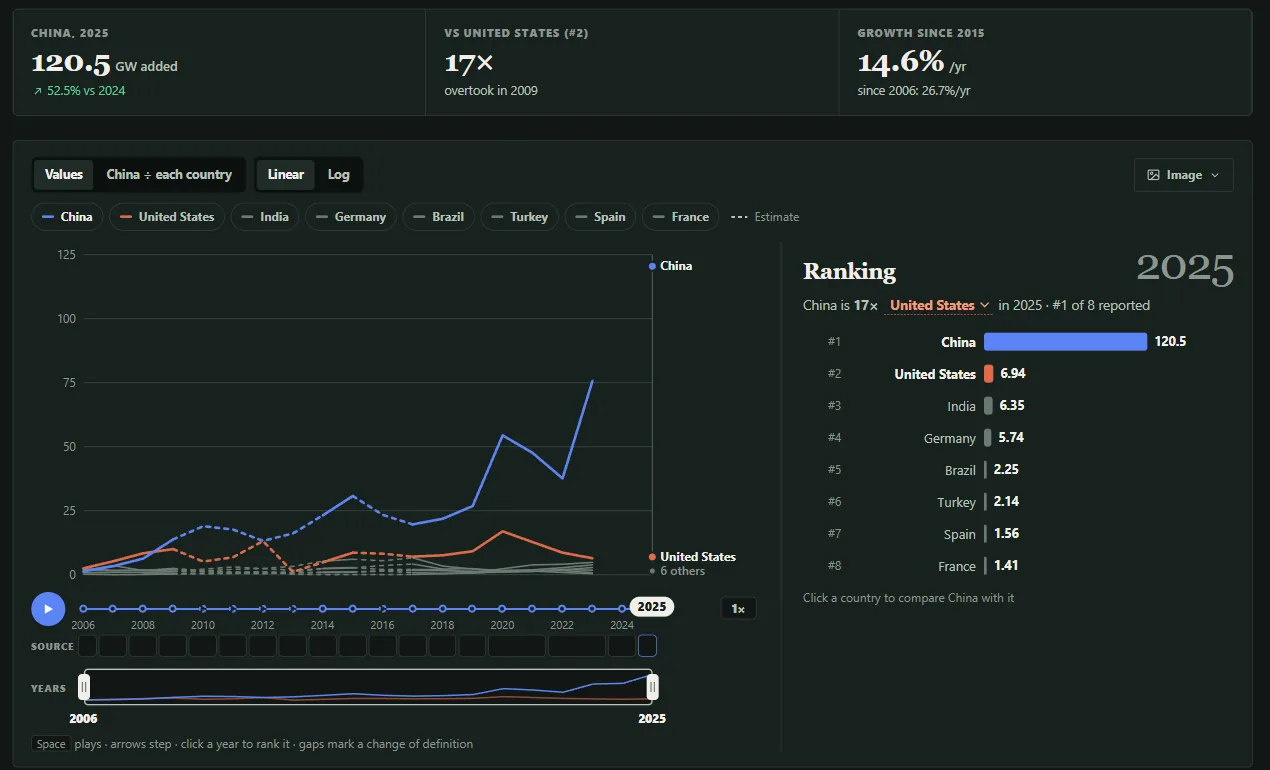
Each metric page starts with a plain summary, like “China leads with 120.5 GW of wind capacity added in 2025, 17× the United States.” Below it, a history chart plays back year by year and ranks the countries for the selected year. Charts export as images, the history exports as an MP4 or GIF animation, and the full dataset downloads as CSV or JSON.
The Explorer and research index filter and search the whole atlas. The Compare Lab puts metrics side by side as a snapshot, head to head, or over time, and converts units only when it’s safe to. Industrial system guides connect metrics from raw materials through manufacturing, deployment, and trade. There are now 51 of them in eight families, from steel and solar to shipbuilding and pharmaceuticals.
Filling in the history
Most metrics started as a single year. For goods trade, I imported CEPII’s BACI dataset, which gives yearly exports and imports for every product code and every reporting country back to 1995. That alone added history to more than 3,000 metrics.
For everything else, a research worker picks gaps in coverage, researches them in ChatGPT, and returns structured JSON. Scripts check each new period against existing values and hold conflicts for review. Values matched against downloaded source data are marked separately from values the model only read from a page. More than 500 other metrics now have history, and new periods reach the public site as each batch is reviewed and published.
How it’s built
The site uses React, TypeScript, and Vite, with no charting library. Data is collected through a private local Node, Express, and SQLite API, then published as a static snapshot to Cloudflare, so nothing public runs on a server. The site loads metric chunks and history on demand. Data contract tests, Playwright journeys, and axe accessibility checks run before each release.